
Illinois Housing Development Authority,
Center for Neighborhood Technology
The Center for Neighborhood Technology’s Housing + Transportation (H+T) Affordability Index provides an enhanced understanding of housing affordability by revealing the transportation costs of a given location and adding those costs to location-specific housing expenditures. In addition to helping house and apartment hunters make more informed decisions about where to live, this tool can help policymakers choose where to invest scant public dollars, particularly when siting affordable housing developments.
We agree with Philip Tegeler that using the index in the way he has described could hinder fair housing goals. However, we believe fair housing metrics and the index can be used in tandem to better disclose access to opportunity and true affordability. Recent analysis by CNT of the Illinois Housing Development Authority’s affordable housing sites in the Chicago area and analysis of data directly from the index offer real-world examples that bear out this thinking.
CNT’s commitment to creating sustainable, livable cities has always included making housing more affordable. The traditional measure of affordability — inside and outside of housing policy circles — begins and ends with the cost of housing. If a household spends 30 percent or less of its income on a house or apartment, it is considered affordable. Yet, the transportation costs associated with a house or apartment are rarely transparent to families or policymakers and can be significant, equaling or even exceeding outlays for shelter.
Nowhere in current information sources is this hidden cost of location disclosed — not in the U.S. Dept. of Housing and Urban Development’s Fair Market Rent measure, not in rental or housing listings such as the Multiple Listing Service, and not in standard housing affordability indices published by HUD. Because relative transportation costs are in large measure a function of specific location, and transportation is overall the second largest household expenditure, this exclusion is a serious omission on both fair housing and consumer protection grounds.
CNT set out to fill this information gap in 2006 by quantifying transportation costs by location in the H+T Index. The index demonstrates how living in a compact, walkable, transit-connected neighborhood can lower a household’s expenses and its environmental impact. It also offers a more comprehensive definition of affordability: that combined housing and transportation costs should not exceed 45 percent of household income. Under the traditional affordability definition, 7 in 10 neighborhoods in U.S. metro areas are affordable. Under our new measure, only 4 in 10 neighborhoods are.
These costs and their underlying data have been constructed and disclosed for all 161,000 Census block groups in U.S. metropolitan regions, using 2000 Census data. The index will be updated this year using the new 2005–2009 American Community Survey five-year data and expanded to include areas within micropolitan regions.
CNT has continually tested and refined the index and believes it can be a useful tool for policymakers in deciding where to invest scarce resources, such as those dedicated to the creation of affordable housing. We believe that the transportation costs revealed by the index, used in coordination with traditional fair housing metrics described in Philip Tegeler’s article, can ensure that access to opportunity is truly affordable.
A recent analysis by CNT illustrates how the index might be used in a housing policy context. Holding housing costs constant, CNT analyzed how affordable housing financed by the Illinois Housing Development Authority (IHDA) fared between 2001 and 2008 in terms of transportation costs, transit access, and employment access. Holding housing costs constant is appropriate because these developments are all seeking to control housing costs for residents and maintain them at 30 percent or less of household income.
Within the city of Chicago, we found that family housing units located outside of HUD-designated Qualified Census Tracts (QCTs) — in other words, in higher income areas — were more likely to be within a half mile of a train station (86 percent vs. 52 percent) than units located in QCTs. These developments also had markedly better access to regional jobs. Our analysis found that average transportation costs in these neighborhoods were slightly higher (about $40 per month) than those in low-income areas with IHDA developments.

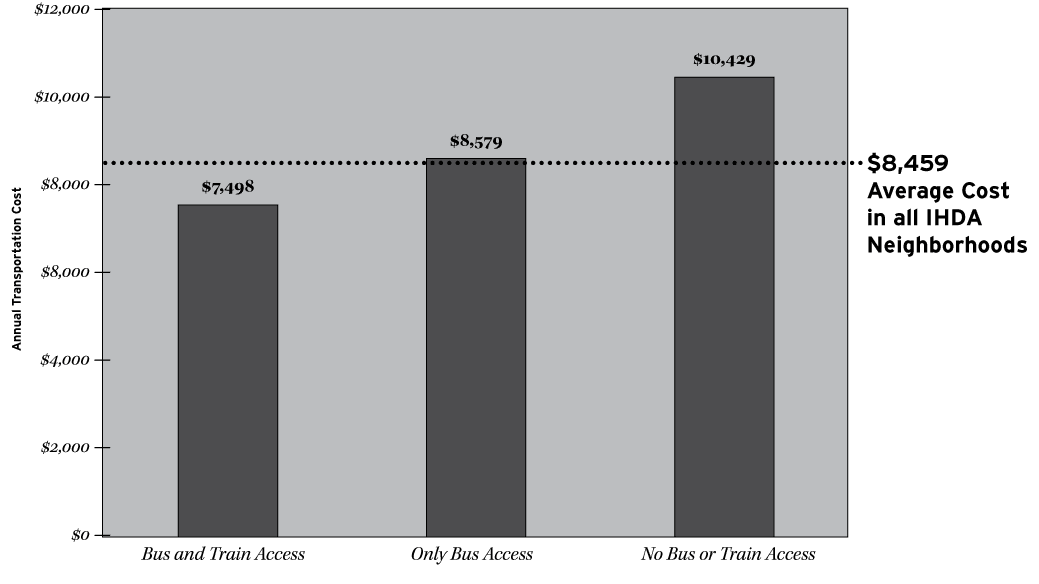
When our analysis expanded to include suburban developments, however, we found that better access to transit correlated to significantly lower transportation costs (see chart). While suburban areas tend to have higher average transportation costs than urban areas, costs vary widely within suburbs, and many suburban locations are both high opportunity and have relatively affordable transportation costs.
Our analysis also revealed that a substantial amount of IHDA-financed affordable housing for seniors had been built in locations with high opportunity and good transit connectivity, but virtually no affordable housing for families had been built in those areas. Neighborhoods with affordable housing developments for seniors had median household incomes about $12,000 higher on average than those with family housing developments and also featured lower average transportation costs.
Chicago suburbs to the west and northwest of the city feature high employment growth, excellent transit infrastructure, and relatively affordable transportation costs, yet these areas contribute far less than their fair share of affordable family housing. Suburban locations generally feature higher average transportation costs than the city, but if policymakers compare apples to apples (weighing developments in urban neighborhoods and suburbs separately), we believe there are significant options for maximizing opportunity while keeping transportation costs low.
Of course every region has different growth patterns, infrastructure systems, and demographic profiles, but CNT’s analysis of affordable housing in Chicago demonstrates that enhanced opportunity and affordable transportation are not mutually exclusive. In fact, fair housing metrics and the transportation costs provided by the H+T Index can and should be combined dynamically to produce an optimal distribution of scarce affordable housing resources. This means that developments featuring the absolute lowest transportation costs should not be promoted if they isolate residents from regional opportunity. But it also means that the impact that transportation costs will have on a household budget must be considered.
A CNT analysis of job access for all 161,000 2000 Census block groups currently covered by the Index also helps illustrate how the tool could be used to improve access to opportunity efforts. We plotted each block group’s average transportation costs for the typical regional household and its employment access, which we define as a geographic measure of regional jobs weighted by proximity. Employment access is one of the input variables in the H+T Index. Locations with low transportation costs actually place households in areas with greater overall job access. Access to jobs, in general, is highest where average transportation costs are low. Holding housing costs constant at 30 percent, as they would be with subsidized affordable housing programs, priority should be given to affordable housing developments that are sited in locations where average transportation costs are relatively low, ideally enabling the targeted households to keep these costs at less than 15 to 18 percent of their income.
CNT does not advocate that its index be used to place affordable housing solely where both housing and transportation costs are lowest. We agree with Tegeler that doing so could unduly limit access to opportunity for low-income households. The value of the index is that it can score locations that do well on traditional fair housing criteria based on the transportation cost burden those locations will impose on families. Existing fair housing metrics omit this important piece of information, and the index can fill that gap.
Are there other costs that could or should go into the affordability equation, as Tegeler suggests? Maybe, but that shouldn’t stop us from utilizing transportation data, now that we have it. With housing and transportation costs together, we have accounted for the two largest expenditures of low-income households, and the vast majority of those costs are location dependent. Adding transportation costs to the equation makes the process of creating equitable affordable housing a bit more complex; ignoring them exposes families who can least afford it to high transportation costs and volatile gas prices, and runs the risk of undoing the very affordability we are all seeking to create.


Comments